
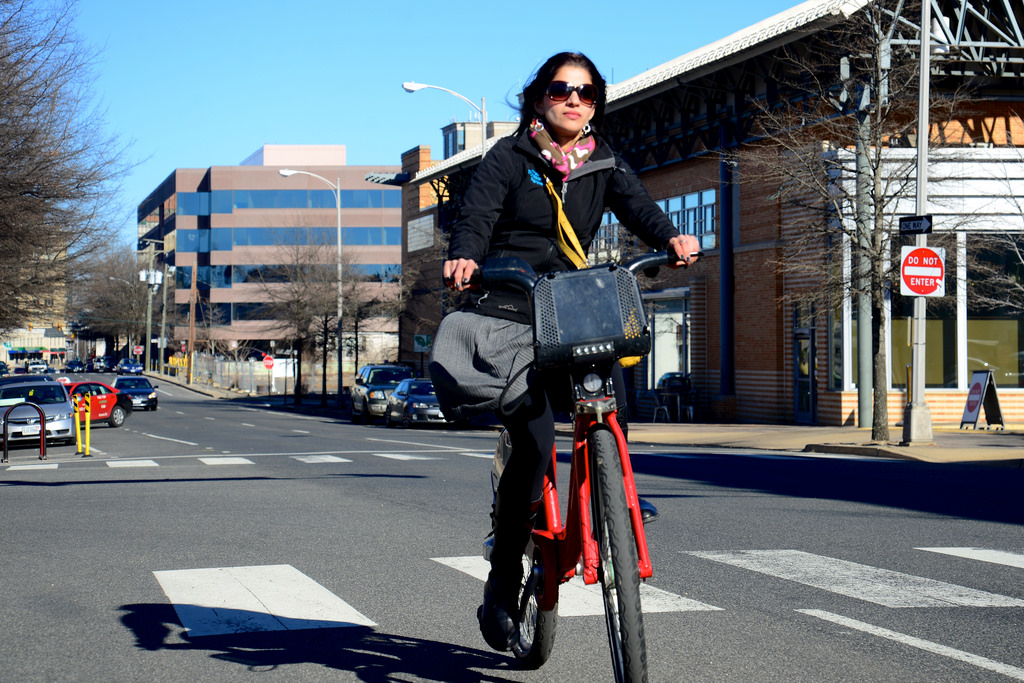
The 2014 Capital Bikeshare Member Survey is the third edition of a survey of members with the Washington region’s Capital Bikeshare system. With more than 350 stations across the District of Columbia, Arlington County (VA), the City of Alexandria (VA), and Montgomery County (MD) at the time of writing, thousands of the region’s residents and visitors have logged more than 9 million trips since the system’s first installation in 2010.
As was the case with surveys from 2011 and 2012, this survey sought to explore:
- Demographic characteristics of Capital Bikeshare users
- Characteristics of Capital Bikeshare trips
- Travel changes made in response to Capital Bikeshare availability
- Users’ satisfaction with Capital Bikeshare features
KEY FINDINGS
On average, members take 13 rides per month on the system. Fifty-nine percent make six or more trips and 24 percent take Capital Bikeshare 20 or more times monthly.
A larger share of Capital Bikeshare members reported using the system for their commute than in the last survey
- Seventy-four percent of members use Capital Bikeshare to get to or from work “at least occasionally,” which is up from about six-in-ten respondents in the 2012 survey.
- However, the biggest use is for entertainment purposes or socializing with friends (85 percent).
Capital Bikeshare helps members reduce their driving, and in a few cases, joining and using Capital Bikeshare leads members to sell a vehicle or choose not to purchase a vehicle
- Eight percent sold a household vehicle in the year leading up to the survey and didn’t replace it. Of that eight percent, 76 percent said that Capital Bikeshare played an important role in the decision.
- More than half of the respondents who reduced their household vehicles now live in “car-free” households, having eliminated their only vehicle.
- On average, members reduced 158 driving miles per year. That equates to 4.4 million miles of driving eliminated annually from the region’s roads.
The “transit-access” role that Capital Bikeshare plays continues to grow
- Though 58 percent of members said that they had reduced their Metrorail ridership since joining Capital Bikeshare, and 52 percent said that they had reduced their bus ridership, Capital Bikeshare’s relationship to other forms of transit is complex.
- Nearly two-thirds (64 percent) of respondents said at least one of the Bikeshare trips they made last month either started or ended at a Metrorail station (compared to 54 percent who said the same in the 2012 survey).
- Of respondents, 21 percent had used bikeshare six or more times for this purpose, up from 17 percent in the 2012 report.
- The share of members saying that they had used Capital Bikeshare to access a bus in the past month remained essentially the same (24 percent in 2014; 23 percent in the 2012 survey).
 Seeing a station and “word-of-mouth” referrals remain the key ways by which people learn about Capital Bikeshare
- Simply having all the stations throughout the region has been the number-one marketing tool for attracting new members. Of respondents, 30 percent said that’s how they became aware of the system. An additional 26 percent of members said that word-of-mouth referrals were how they learned.
- Social media and news articles about Capital Bikeshare have played a decreasing role in raising awareness about the system.
Members’ stated reasons for joining Capital Bikeshare have remained consistent over time
- Ninety-four percent were motivated to join because they wanted to be able to get around “easily and faster.”
- Eighty-four percent said that they were attracted to Capital Bikeshare as a “new and one-way travel option.”
- The “fun” of biking was a reason to join for 77 percent of survey respondents.
- As in years past, younger members more frequently mentioned than their older counterparts that they joined in order to speed their travel and to save money, while older members tend to be more interested in exercise, health and helping the environment.
The average Capital Bikeshare member saves $710 each year in transportation costs by using Capital Bikeshare
- Based on self reports, the average member saves $13.65 per week on transportation costs by substituting travel on another mode with a Bikeshare ride.
- That equates to $710 per member per year. For members who make 11 or more trips per month, the average monthly savings ramps up to $1,002.
- When applied across the 27,600 members with the system at the time of the survey, these savings equate to savings of $19.6 million per year on personal travel costs.
Capital Bikeshare members remain demographically different from the region’s population
- As stated in the report’s Executive Summary, “compared with all commuters in the region, were, on average, considerably younger, more
likely to be male, Caucasian, and slightly less affluent.
-
However, the membership has grown older; in 2011, 14 percent of members were 45 years or older, but in the new survey, 20 percent fill that age range.
- The most striking increase in the average member profile is that 39 percent claimed $100,000 or more in salary in 2011, while now a full 50 percent state that as their current income.
DOCUMENTS FOR DOWNLOAD
Capital Bikeshare 2014 Member Survey Summary Presentation (PDF, 4 MB)
Capital Bikeshare 2014 Member Survey Executive Summary (PDF, 1 MB)
Full report also available on the Capital Bikeshare System Data site.
Mobility Lab’s blog summarizing the findings.