Infographics
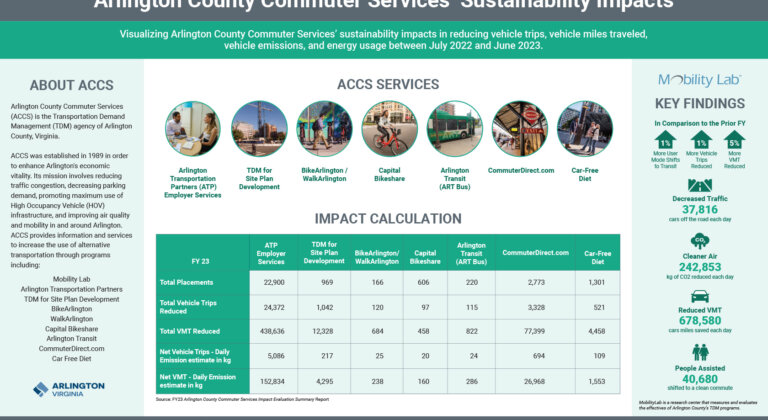
Arlington County Commuter Services’ Sustainability Impacts 2023
Key highlights for visualizing Arlington County Commuter Services' sustainability impacts in reducing vehicle trips, vehicle miles traveled, vehicle emissions, and energy usage between...
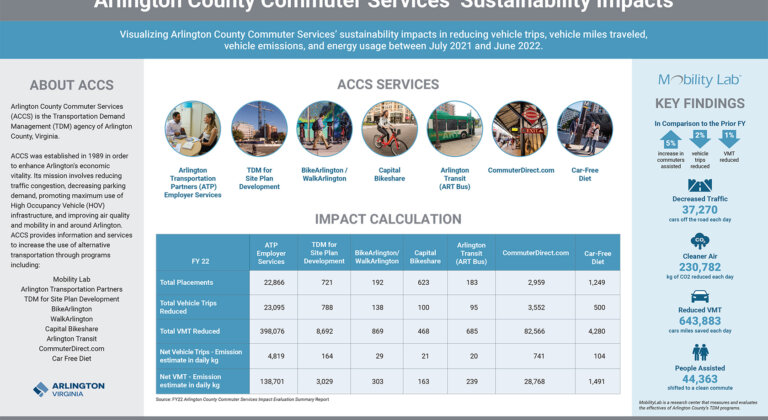
Arlington County Commuter Services’ Sustainability Impacts 2022
Key highlights for visualizing Arlington County Commuter Services' sustainability impacts in reducing vehicle trips, vehicle miles traveled, vehicle emissions, and energy usage between...
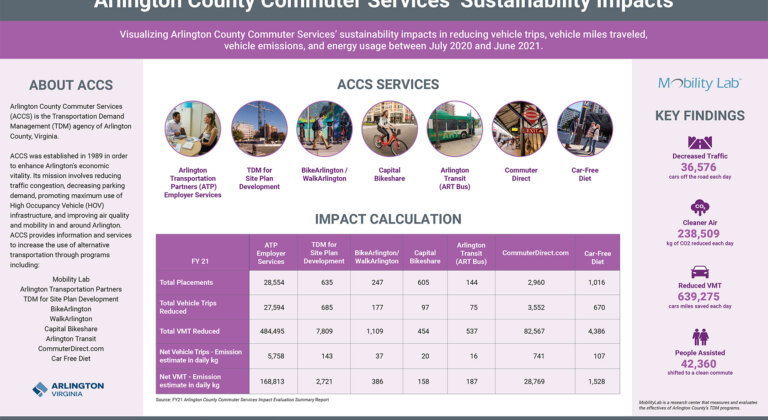
Arlington County Commuter Services’ Sustainability Impacts 2021
Key highlights for visualizing Arlington County Commuter Services' sustainability impacts in reducing vehicle trips, vehicle miles traveled, vehicle emissions, and energy usage between...

A Social-Media Playbook for Changing Commuting Behaviors
Social media is an increasingly powerful tool to improve messaging about the values of public transportation.

Myth: Funding Public Transportation is Too Costly
Download
Major U.S. DOT Study Emphasizes Need for More Transit, Biking, Walking
Download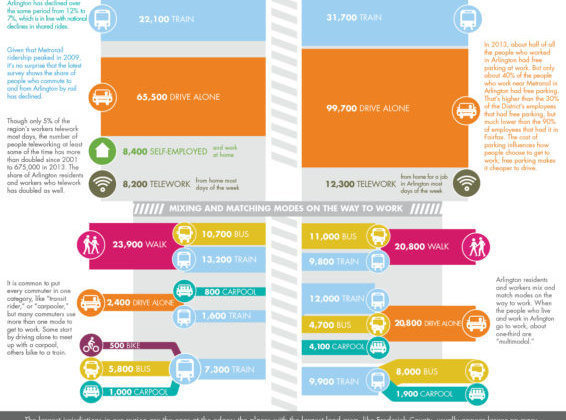
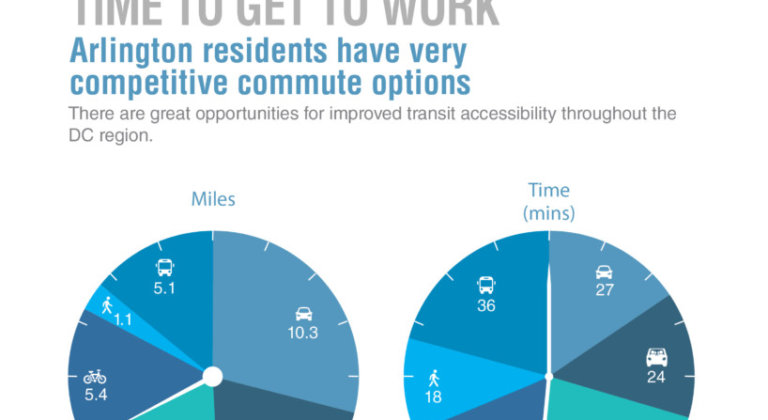
The Arlington Way of Life: Time to Get to Work
Download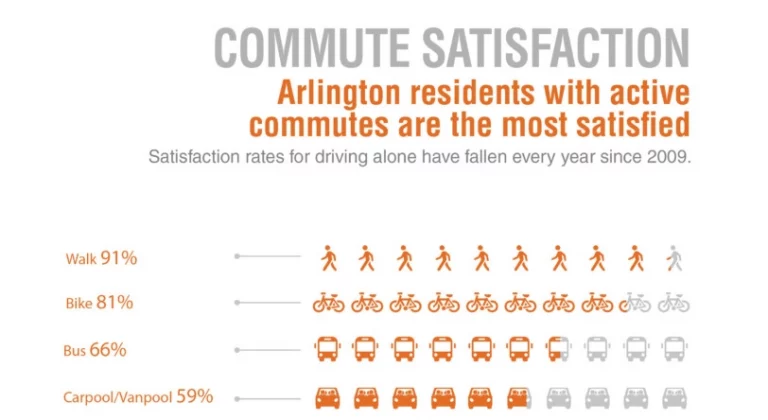
The Arlington Way of Life: Commute Satisfaction
Arlington residents with active commutes are the most satisfied

The Arlington Way of Life: Commutes to Other Jurisdictions
Where Arlington residents work determines their commute
Contact Us
The Mobility Lab team greatly appreciates your feedback.
If you would like to read our Express Newsletter featuring our latest TDM research and commentary sent directly to your inbox, click to Subscribe.
Mobility Lab
1501 Wilson Boulevard, Suite 1100
Arlington, Virginia 22209
703.228.6558