Mobility Lab presents the key highlights of the American Community Survey (ACS) 2018 1-Year estimates, with particular focus on insights about how people in Arlington County, Virginia travel to work. The key highlights also include a brief methodology of the American Community Survey.
ACS is a national survey conducted by the US Census Bureau that provides information on employment, educational attainment, various household characteristics, and other vital topics. ACS also provides information relating to transportation to work by releasing data estimates on the means of transportation to work, time leaving home to get to work, and travel time. Specific information on transportation to work is available for sub-groups of the population, such as by race and ethnicity, sex, type of worker, etc. This makes ACS similar to the State of the Commute. Mobility Lab also created a summary of key highlights and Arlington-specific insights from the 2019 State of the Commute Survey Report.
However, there are two key differences between ACS and the State of the Commute (SOC). First, ACS is a national survey while SOC is focused on the Metropolitan Washington Region. Second, SOC releases information every three years, while ACS continuously collects data, resulting in updated information available on a more frequent basis. ACS 1-year estimates are released every year based on data collected during a calendar year. For example, 2018 1-Year Estimates is based on data collected for the period of January 1, 2018 to December 31, 2018. ACS 5-year estimates are also available for certain time periods.
What were some of the main highlights for Arlington? We chose five key results that we describe below.
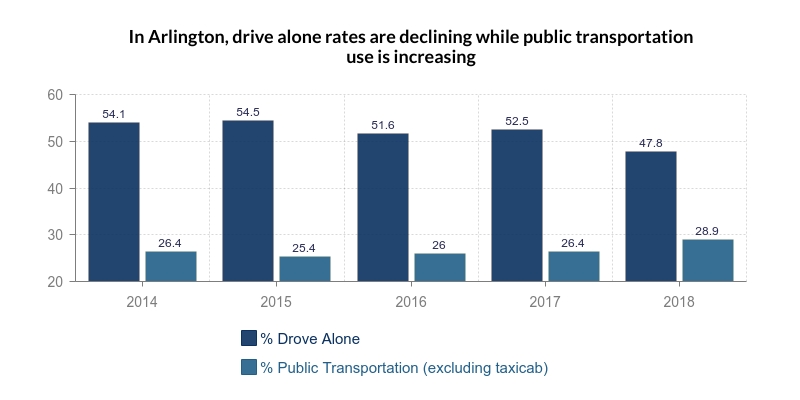
- Drive alone rates dropped to 47.8% and public transportation use increased to 28.9% in 2018.
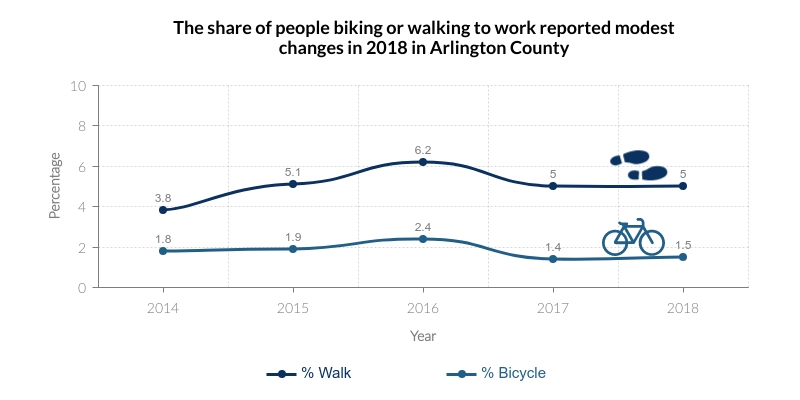
- Biking and walking reported modest changes in 2018. Biking is up by 0.1 percentage point (1.5%), while walking is down by 0.04 percentage point (4.96%). When it comes to biking to work, males largely outnumber females: for each female who bikes to work there are five males who bike to work.
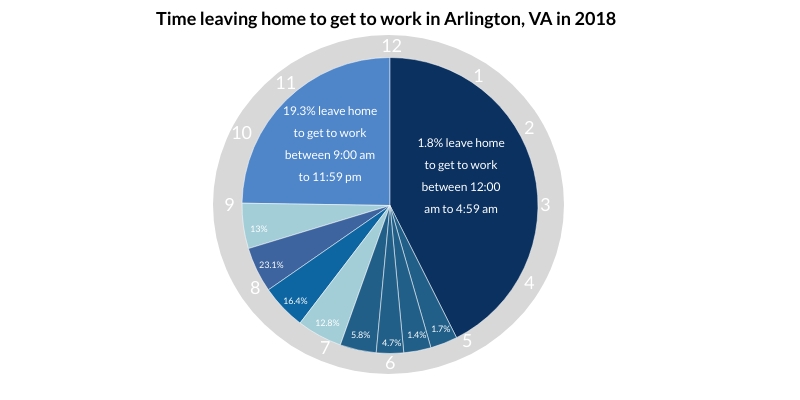
- Two out of three workers leave home to get to work between 7:00 AM to 8:59 AM. The morning work commute rush peaks from 8:00 AM to 8:29 AM.
- The average work commute is 30.1 minutes long. The mean travel time to work varies according to mode: 35.1 minutes for public transportation, 28.5 minutes for carpool, and 27.8 minutes for drive alone.
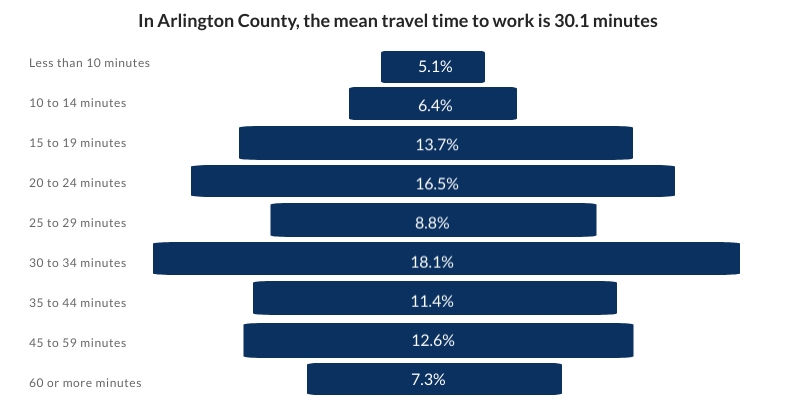
- The highest proportion of workers (18.1%) spend 30 to 34 minutes traveling to work, followed by 16.5% who spend 20 to 24 minutes traveling.
Drive alone rates drop to 47.8% and public transportation use increase to 28.9%.
Drive alone rates decreased to 47.8% in 2018 from 52.5% in 2017 and this difference was statistically significant. These rates are lower than the U.S. national average of 76.3% in 2018, but still higher than Washington, D.C. (34.2%).
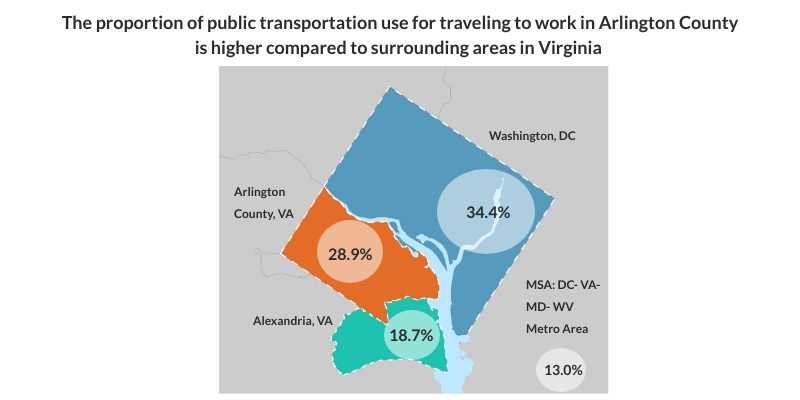
Use of public transportation continues its increase since 2015 to 28.9% which is higher than the U.S. national average of 4.9%, but still lower than in Washington, DC (34.4%).
 Source of data: American Community Survey 1-Year Estimates, 2018
 Source of data: American Community Survey 1-year Estimates, various years
The share of public transportation use for traveling to work has been increasing in the past four years.
The share of public transportation as a mode for traveling to work increased to 28.9% in 2018 from 26.4% in 2017. The share of public transportation use for work commutes has been increasing each year since 2015. Public transportation use in Arlington is higher compared to rates in Alexandria, Virginia (18.7% in 2018), the region (13.0% in 2018) and nationwide (4.9% in 2018). In the region, only Washington, DC reported a higher rate of public transportation use at 34.4% in 2018.
 Source of data: American Community Survey 1-year estimates, 2018
Map Designed by Jessica Peyton
Among those who use public transportation to travel to work, Metrorail and buses are still the most popular modes: 70% use Metrorail (denoted as “Subway or elevated mode”) while 29.1% take the bus. The smaller percentage who reported using other modes use the streetcar (0.4%), railroad (0.2%), and ferryboat (0.2%) for traveling to work.
To contextualize, there are four Metrorail lines that run though Arlington with a total of 11 stations: Rosslyn, Courthouse, Clarendon, Virginia Square-GMU, Ballston-MU, East Falls Church, Arlington Cemetery, Pentagon, Pentagon City, and Ronald Reagan Washington National Airport.
Arlington’s bus service, Arlington Transit (ART) bus, has 16 routes throughout Arlington County, in addition to select Metrobus service.
 Source of data: American Community Survey 1-year estimates, 2018
Biking and walking reported modest changes in 2018
The share of people who biked to work registered at 1.5% in 2018, compared to 1.4% in the previous year. The 1.5% share of people who bike to work is lower than when its peak share of 2.4% in 2016, during the five-year period of 2014 to 2018. On the other hand, 4.96% reported walking to work in 2018, compared to 5.00% in 2017.
 Source of data: American Community Survey 1-year estimates, various years
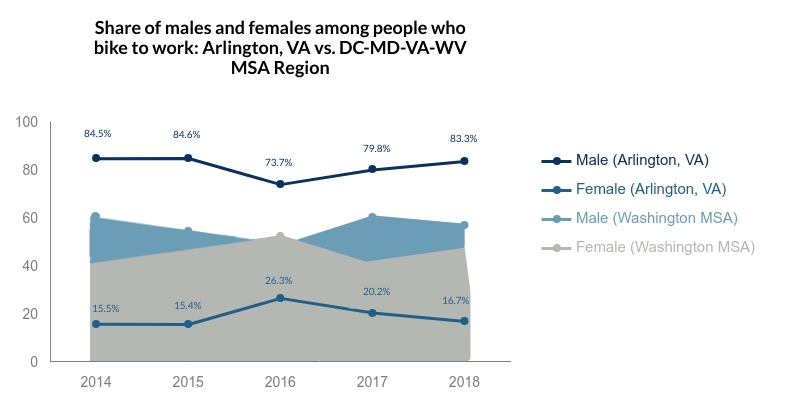
When it comes to biking to work, males largely outnumber females: for each female who bikes to work there are five males who bike to work.
When it comes to biking, a higher percentage of men reported biking to work (2.4%) than women (0.5%). The same disparity can also be observed in Washington, D.C. (5.4% of men bike to work compared to 3.3% of women) and nationwide (0.7% of men bike to work compared to 0.3% of women). In Arlington, the share of males who bike to work is higher when compared to the region, while the share of females who bike to work is much lower. To illustrate, in 2018 males comprise 83.3% of people who bike to work compared to 56.8% of people in the DC-MD-VA-WV region, while females comprise 16.7% of people who bike to work compared to 43.2% in the DC-MD-VA-WV region. The trend has been observable in the past five years.
 Source of data: American Community Survey 1-year estimates, various years
Note: Washington MSA stands for the DC-VA-MD-WV Metropolitan Statistical Area
The Washington-Arlington-Alexandria, DC-VA-MD-WV Metropolitan Statistical Area (MSA) is defined by the Census Bureau to include the following areas: District of Columbia; Arlington, Clarke, Fairfax, Fauquier, Loudoun, Prince William, Spotsylvania, Stafford, and Warren Counties, and Alexandria, Fairfax, Falls Church, Fredericksburg, Manassas, and Manassas Park Cities in Virginia; Calvert, Charles, Frederick, Montgomery, and Prince George’s Counties in Maryland; and Jefferson County in West Virginia.
In Arlington, the average work commute is 30.1 minutes long.
The mean travel time to work for Arlington is 30.1 minutes, which is at par with Washington, DC (30.9 minutes) but longer than the national average of 27.1 minutes. The highest proportion of workers report spending 30 to 34 minutes traveling to work (18.1%), a decrease from 21.5% in the previous year. The second highest share (16.5%) report spending 20 to 24 minutes traveling to work, an increase from 11.6% in the previous year.
The mean travel time to work varies according to mode: for those who used public transportation, the mean travel time is 35.1 minutes longer than those who carpooled (28.5 minutes) and drove alone (27.8 minutes).
 Source of data: American Community Survey 1-year estimates, 2018
Two out of three workers leave home to get to work between 7:00 AM to 8:59 AM. The morning work commute rush peaks from 8:00 AM to 8:29 AM.
65.3% of workers leave home to get to work between 7:00 AM to 8:59 AM. The peak period during the morning rush is 8:00 AM to 8:29 AM, the time when the highest percentage of workers leave for work (23.1%). Late-night workers may be accounted for as part of the 19.3% of workers who leave home to get to work between 9:00 AM to 11:59 PM.
 Source of data: American Community Survey 1-Year Estimates, various years
Methodology
The American Community Survey (ACS) is a national survey conducted by the US Census Bureau that provides information on employment, educational attainment, various household characteristics, and other vital topics. Data is continuously collected for the ACS to generate insights from a representative sample of the population.
ACS 1-year estimates are released every year based on data collected during a calendar year. For example, 2018 1-Year Estimates is based on data collected for the period of January 1, 2018 to December 31, 2018. ACS 5-year estimates are also available for certain time periods.
In terms of travel behavior, the ACS also provides information relating to transportation to work by releasing data estimates on the means of transportation to work, time leaving home to get to work, and travel time. Specific information on transportation to work is available for sub-groups of the population, such as by race and ethnicity, sex, type of worker, etc.
To compile the highlights for Arlington County, Mobility Lab extracted information from selected tables provided as part of the American Community Survey’s 1-Year Estimates for 2018. Data from previous years were also used as needed, using 1-Year Estimates from previous years to provide comparisons over time.
To make meaningful comparisons, Mobility Lab conducted statistical testing as needed, using the Statistical Testing Tool provided by the Census Bureau. The Census Bureau’s Statistical Testing Tool uses a confidence level of 90 percent when testing for statistical significance.